
 By Bill Scott, President, StoreReport LLC
Lately, I have been looking for new ideas regarding analyzing the millions of records we have accumulated over the past 13 years. You can find yourself lost in analysis if you are not careful. However, there is something about it that intrigues me. Assumptions have the propensity of becoming fact, unless you constantly reevaluate them for accuracy.
Here we have two charts. The sample data is for the first quarter of 2016. I used a divisor of 12.9 to represent the number of weeks in the quarter. The first chart divides cigarettes into six major groups, with each group representing a group of products that share a range of quantities sold in the course of one week (averaged).

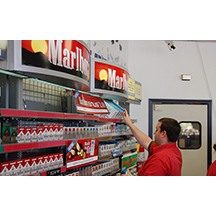
The stores sampled each had 305 brands of cigarettes on their shelves. Roughly 2% (approximately six brands) sell in excess of 1,000 per week which is not surprising. What was shocking, is that 39% (roughly 119 brands) account for sales of LESS THAN one pack per week. This means if a retailer has $240,000 tied up in inventory in 30 stores, nearly $100,000 of that money is a wasted investment.
We all know basically how the cigarette contracts work. Little or no profits are made on the sales, and you get a “big, fat check” periodically to pay for the advertising space that the cigarettes occupy in the store. Common sense tells us that these contracts lean in favor of the cigarette manufacturers; so it follows that we need to take a closer look at these arrangements to see just how much in favor of the manufacturers these contracts lean. There may be an awful lot of wasted space in your store where other, more profitable items can be displayed.
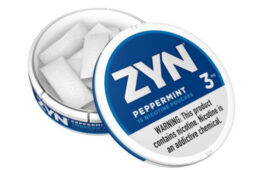
Following along the same line of thought, I decided to create a similar chart for Other Tobacco.

I’ll admit up front that there is no correlation between the two graphs, except to say that products that are selling in quantities of LESS THAN one per week in either group probably should not be in your stores. My customers tell me all the time, “If we don’t have the products they want, then they won’t come back.” While this statement may be true, I advise them to look at the tenders where these products are sold, and see if people buying this products are purchasing a substantial number of other products that make carrying that product worthwhile.
I’ve talked often about the three cans of octopus soup I found in one store. It had been there for three years, and it got there because a customer ask for it and never came back for the other three cans. While three cans of octopus soup may not impact the larger picture overall, it is the thousands upon thousands of other products performing in that way that can determine whether a store is profitable or unprofitable.
I am reminded all of the time that 45% of sales in convenience stores are non-profitable, and it follows that an equal percentage of consumers frequenting stores are also unprofitable. If you are not tracking the items you are selling, and how much profit there is on each and every sale, then whether or not you are profitable has more to do with luck than anything else.
You should strive to make an attempt to make your decisions based on the data instead. It’s not difficult, and it will be worth your time.