Reid Petroleum’s Crosby’s, which operates more than 88 c-stores in New York and Pennsylvania, is using historical sales pattern analysis combined with automation in its inventory management practices. When it comes to its Dairy Order Guide, for example, “we generate monthly order guidance from a six-week rolling sales window. The logic excludes weeks where a store had zero sales, which skews averages down artificially, and applies a formula on the average, so we’re always in-stock on an important perishable item,” said Rob Augustine, director of sales and merchandising for Crosby’s Stores.
Then, on the analytics side, its IPR provides a multiperiod view of where margin is moving independently of volume. “For example, milk has shown strong gross margin percentage improvement year-over-year in recent periods, but the post-shrink gross margin percentage tells a starkly different story; in several periods it falls well below pre-shrink gross margin percentage,” Augustine said. “Flagging that shrink is meaningfully eroding the category’s real profitability. That kind of analysis would be invisible if we only looked at top-line sales.”
Then, for supply chain visibility, Crosby’s built recurring backorder tracking that flags items based on how many consecutive weeks they have been unavailable. If an item has been backordered for three or more consecutive weeks that issue is escalated, Augustine explained. The chain can see which vendors are behind the issue, and which categories are most impacted, allowing it to determine if there is a vendor problem or an internal ordering issue.
At Vintners Distributors, which operates 157 Loop Neighborhood Market and Poppy Markets in California, in addition to manual vendor orders based on physical inventory and suggested orders based on sales, the chain uses a suggested ordering software built within its back-office system, said Matthew Makarem, director of loss prevention & employee development for Loop Neighborhood Market.
The suggested ordering software can also be manually altered to account for activities or events at each location. It measures on-hand inventory by item and forecasts orders based on historical sales. This keeps inventory on-hand in stock and reduces the risk of running out of items while maintaining enough stock to satisfy customers. “We use frequent orders sometimes twice a week for high turnover items,” Makarem added.
Balancing inventory levels to control costs without risking out-of-stocks and lost sales is an ongoing challenge for c-store operators.
“…It’s a constant tension, and the right balance depends heavily on the category,” Augustine said.
In the case of perishables such as dairy, Crosby’s focuses on adequate coverage because the cost of losing a sale or a customer outweighs the costs of modest outdates.
“Our order guides are designed to err on the side of coverage, and we build in a formula so managers can see the suggested quantity relative to what they have on hand, rather than ordering blindly,” Augustine said.
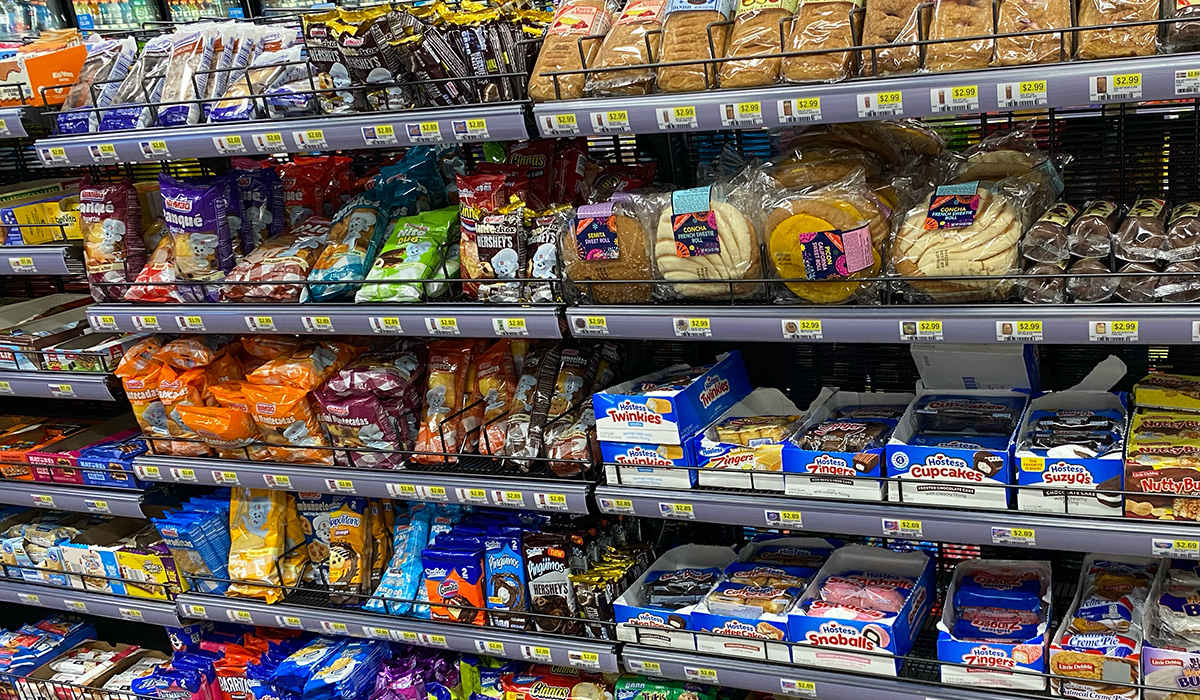
But when it comes to center store categories, the chain is more disciplined about how it approaches its assortment. In this area, Crosby’s has found that having too much inventory can dilute facings, complicate ordering and result in slow moving items taking space away from faster moving ones.
“We use SKU productivity metrics to flag items that are below velocity thresholds and build a deliberate case for cuts rather than letting assortment creep,” he said.
Meanwhile, items that are chronically high waste from outdates might need a different placement, format or may need to be removed entirely, he explained.